Whitepaper: Operationalizing EHS Data

With continually improving and more readily available technology, companies are ideally positioned to achieve success in EHS, but a fair amount of logistics are required. Our aim is to help you understand and navigate the landscape of EHS operationalization.
You may be thinking; “We’re safety people, not data experts.” However, like a ship’s captain uses relevant data to drive decision-making, you’ll need that same capacity to chart the path and stay on course. Understanding what data is relevant, and what resources are necessary to maintain it will save you from a lot of rework. While you may not be a technology expert, everyone understanding the task and their role is an essential starting point.
Take into consideration the data you currently have and identify what would be most beneficial. How is your team involvement, leadership commitment, and level of communication? All of these factors will impact your journey in driving continuous improvement.
Continue Reading
Fill out the form to continue reading
Operationalizing EHS Data
A Standardized Approach to Mapping Success
With continually improving and more readily available technology, companies are ideally positioned to achieve success in EHS, but a fair amount of logistics are required. Our aim is to help you understand and navigate the landscape of EHS operationalization.
You may be thinking; “We’re safety people, not data experts.” However, like a ship’s captain uses relevant data to drive decision-making, you’ll need that same capacity to chart the path and stay on course. Understanding what data is relevant, and what resources are necessary to maintain it will save you from a lot of rework. While you may not be a technology expert, everyone understanding the task and their role is an essential starting point.
Take into consideration the data you currently have and identify what would be most beneficial. How is your team involvement, leadership commitment, and level of communication? All of these factors will impact your journey in driving continuous improvement.

Data Focus Matters
Biggest decisions for EHS leaders
One of the biggest decisions for EHS leaders (and often one of the biggest struggles) is determining what to measure. The tendency is to revert to “industry standard” rate-based failure metrics or arbitrary quotas. When peeling back the layers, statistics such as lost time frequency rates, experience modification rates, counts of injury-free days, and near misses are often found to be hollow, largely based on luck, and negatively influencing the workplace culture. Your focus is best served when it is qualitative, company-centric, geared towards improving performance, and supported by data. Potential questions to ask when evaluating different data types could include the following:

Data Type 1
Inspections
Diversity – Are the appropriate people for performing inspections from a varied group?
Inspection Strategy – Were the tenets of who, what, when, and where clearly incorporated within the inspection?
Documentation – Are legitimate comments provided for all unsafe determinations?


Data Type 2
Near Misses
Do employees understand the value of reporting near misses?
Are employees recording actual near misses or simply observations of unsafe conditions?
Are the near misses that are reported qualitative, i.e., focused on SIF-potential and accurately classified?
Is there commentary providing context for near misses?
Are SIF-potential near miss investigations prioritized on the same level as serious incidents?

Data Type 3
Fleet
Is there a decreasing trend of negative outcomes for CMV inspections?
Are all fleet vehicles comprehensively inspected
before use?
Are onboard cameras present to confirm appropriate use of seatbelts, the absence of distractions, and adoption of safe driving practices such as maintaining speed limits and following distance?

Targeted Goals and Objectives
Setting goals and objectives is an important part of this process
Within organizations, we frequently see goal-setting linked to an annual bonus or a corporate reporting initiative, but a prescriptive approach is necessary to support success. The business tactics of reporting just for reporting’s sake or to find easily attainable metrics to earn extra financial backing are confusing, misguided, and do not usually include actual communication between leadership and workers.
These approaches do not support data operationalization and will not result in process improvement. Successful process improvement is driven by setting goals that specifically counter recognized problem areas. The following are examples of objective ways to incorporate this:

Example 1
Inspections
If employees are not currently conducting any inspections or are in the introductory phase, a basic participation goal of one inspection per person, per week (or a similar variation) is a great place to start. However, if a lack of desired results (not lack of participation) is the issue, creating goals consistent with improving specific problem areas is the appropriate course of action.
Consider specifying a goal that emphasizes not just participation, but also diversity, strategy, focus, and documentation. An evolved objective may include each manager conducting one inspection per week that is focused on high hazard work (lockout, work at elevation, confined space) and requires conversational documentation for all identified at-risks.

Example 2
Near Misses
The value of near-miss reporting lies in much more than the generation of arbitrary status reports. Setting a goal to report based on the number of hours worked (e.g., one per 50k hours) means you will typically receive just that, and the quality of information will be lacking. Consider a twofold approach by (1) linking your goal to the potential for SIF (Significant Injuries or Fatalities) and (2) setting a secondary goal to target a causal path analysis conducted on 100% of the reports. This strategy emphasizes high-value situations before they result in significant losses and elicits preventative action.

Example 3
Fleet
In certain cases, depending on the line of work, fleet exposure can pose the most significant risk to an organization. In this example we will assume the common, problematic scenario in which the company has received repeated DOT violations that are centered around the brake check portion of a pre-trip inspection. Rather than requiring supervisors to check a box determining that an inspection has been completed by their drivers, set a goal requiring the supervisor to complete a purpose-built checklist that evaluates the efficacy of the inspections completed by their drivers, along with a weekly report scored for thoroughness. This encourages focus and accountability by the manager for the entire process (including the brake system) and provides an opportunity to identify all areas for improvement.
The goals you set will directly impact the quality of your data. A strategic approach entails understanding where improvements are needed before setting goals. Failing to plan based on available data will result in an abundance of less valuable data requiring parsing, due to employees chasing a number to stay off the “quota radar.”
Information Action Blueprint
A multifaceted approach, planning, and coordination of resources
Once a company decides how and what will be measured, the next step is formulating a blueprint to ensure the data collection efforts are communicated and understood by all and lead to continuous improvement.
This best practice requires three things: a multifaceted approach, planning, and coordination of resources. Your plan must be relevant to your points of measurement, appropriate for your team, inclusive, and lead to appropriate action.
There are 4 recommended steps for structuring a properly implemented plan for improvement.

Step 1
What information needs to be distributed?
Each exampled data source (inspections, near misses, fleet) has the potential to provide a wealth of information. Prioritizing which are the highest areas of importance for your organization is relative to risk and loss potential.
If inspection participation is lacking, the captured inspections are not qualitative, or drivers are operating unsafely, those specificities must be made known to drive action and support the continuous improvement process. Once the relevant data has been identified for distribution, add a section to the plan that establishes the perceived benefit for each line item.
Step 2
Who will receive the information for the greatest impact?
Choosing who receives actionable information and then taking appropriate action, is as important as the capture process. Recipients should be a mixture of general employees, department leaders, supervisors, and executives. An Information Action Blueprint details specific recipients and the information they will receive (information for the CEO will be distinctly different from what a shift supervisor requires, and so must be clearly defined.)
There is always the possibility that process changes such as these are a considerable shift for the organization, and as such, anticipating the need to coach recipients is essential for responsible implementation. Recognition of the potential for employees to refuse participation will also need to be addressed.
Step 3
How/When should the information be conveyed?
Attention spans are often limited by workloads and many other unknown factors, so any form of communication with purposeful intent to drive action (whether meetings, emails, dashboard layouts, or reports) must be clear and concise.
The “when” aspect of planning defines the most favorable time and frequency for the selected team member to receive their actionable information. Preliminary discussions with team members will ensure the appropriateness of the designated method of communication.
For example, an immediate notification would be appropriate for observation details that included a life-threatening scenario. For less dangerous, unresolved corrective actions, a notification once per week may be sufficient. A quarterly participation report might serve for a plant manager, but immediate supervisors would benefit more from a weekly distribution. Choosing the specific time and day of the week that meetings are held and emails are sent is also important, with certain times being better than others. Soliciting feedback will gauge whether those timing decisions were effective or not.
When planning “how” to communicate, recognize that a one-size approach does not fit all. A combination of tools may be necessary to provide people with the right information. Listed below are a few frequently used communication strategies:
CSV/XLS Tabular Extracts – Utilizing Excel documents can be a help or a hindrance, as employee experience levels are quite varied. A select few may be highly efficient users, capable of creating brilliant dashboards and using formulas, PivotTable, Power Query, and PowerPivot to their advantage. However, if this is the only form of communication available, and your employee base is largely comprised of inexperienced users, value will be lost due to time and knowledge constraints.
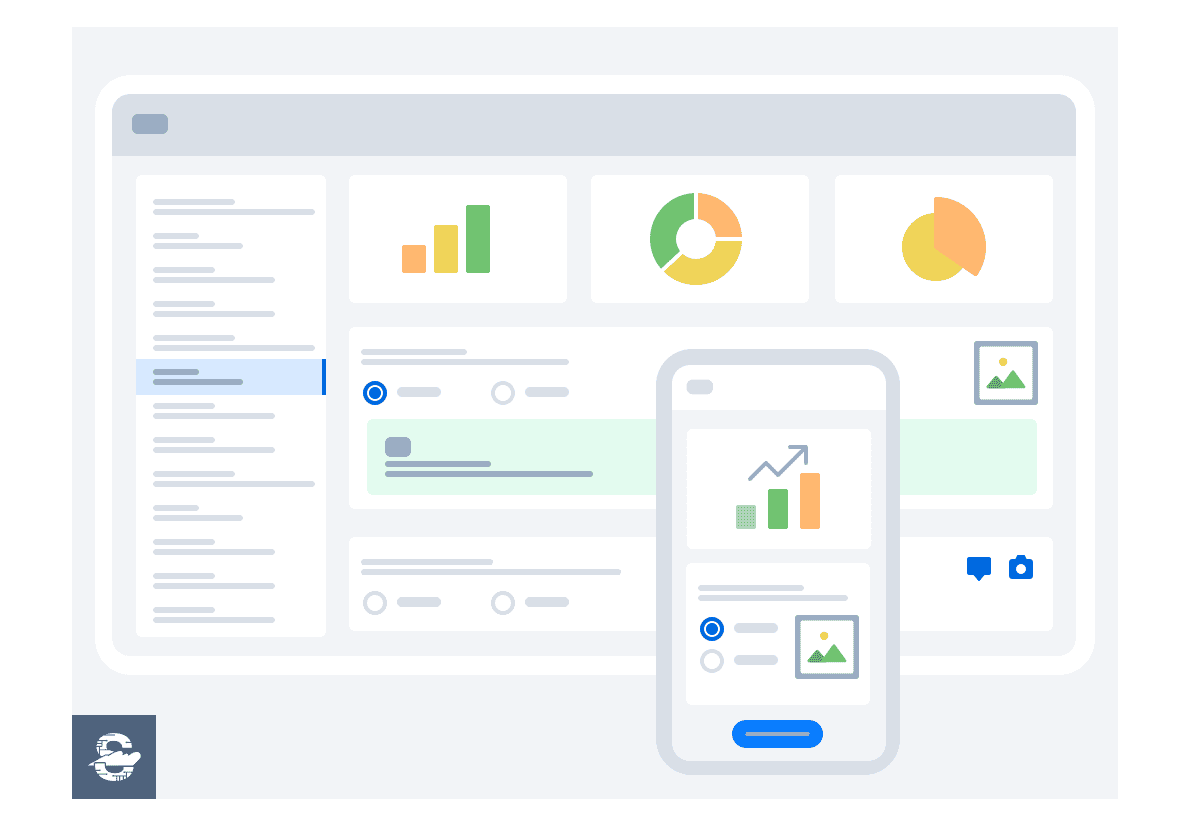
Dashboards – A common prerequisite for this method is either having a person with a wide range of skills or a team, depending on the size of the company. Key aspects of dashboards include scoping, data architecture (managing systems and collecting/sanitizing data), and data visualization.
Successful dashboards take into consideration the user experience. Practices for operative design include the following:
- Avoiding overcrowding
- Prominent placement of high-priority data points
- Assigning correct filters
- Concise labeling
- Maintaining accuracy
Dashboards put words to pictures and enable near-real-time trending for clearer and more efficient decision-making. A single, correctly constructed dashboard with accurate filters and data modeling can support your entire hierarchy and multiple data points.
Digital EHS System Reports – Reports generated from a digital EHS system can streamline and amplify communication efforts. Cloud-based systems regularly include not only the ability to record incidents and inspections via desktop and mobile devices but also many other aspects of data management (e.g., training, SDS management, and permitting.) When using a system to capture data, there are usually a number of canned reports to download, review, and schedule. Choosing which of these to schedule must coincide with prior-identified areas requiring attention. The following are generalized report examples:
- Inspector Participation – Outlines who participated and whether diversity was incorporated (Managers/Non-Managers).
- Inspection Quality – Displays inspected categories, whether comments were clear and concise, and if the information supported creation of a causal path analysis.
- Fleet Violation Summary – Details violations that occurred to determine needed changes in messaging, personnel, and/or inspection strategy.
- Near Miss – Identifies near miss occurrences and patterns for focus.
Reporting is an organized way of directly conveying information to recipients, with little (if any) additional data manipulation.
1:1 Meetings – Face-to-face meetings generate greater levels of engagement, accountability, and collaboration than a standalone digital approach. A focused agenda, diligent notes, opportunities for participation, handouts/visuals, transparency of shared information, and accountability for both attendants are key elements for successful meetings.
As detailed in Step 3, “how” and “when” can have a significant impact on the outcome. Strategy in interactions filters out the noise and garners attention.
Step 4
What does continuous improvement look like?
The continuous improvement process accentuates the changes that are necessary to prevent backsliding and confirm progress toward operationalization. The Plan, Do, Check, Act cycle (Deming,1982) is a universally accepted tool to facilitate this approach and is defined below:
Plan – Is a plan (and sub-plan for specific process items) in place to address the operationalization of data?
Do – Does each team member understand their role and are they taking prescribed action?
Check – Is the plan working, i.e., outcomes are being realized and verified by data?
Act – Are actions being taken when aspects of the plan are found to be ineffective or requiring improvement?
To provide an unbiased review, this circular verification step can be assigned to a dedicated steering subcommittee.
Conclusion
Operationalizing your EHS data through a holistic, company-centric approach saves time and effort. Within this technique is the continual assessment of available data against known problem areas and the development of qualitatively focused goals based on driving actionable outcomes.
As the program progresses, it will be refined, resulting in data quality and data intelligence gains. This has positive downstream implications in the use of machine learning and other advanced analytics (e.g., natural language processing and forecasting.)
While the Information Action Blueprint serves as a roadmap to continuous improvement, it specifically ensures that both the right data points are selected and the right people are receiving information in a timely and useful fashion. Ideally, a blueprint is an execution of data-driven decision-making, maintained as a living document that stakeholders contribute to, follow, and update over time. Any process improvement program such as this takes an entire team backed by company commitment (i.e., financial investment, firm messaging, and leadership by example.)
References
Deming, W. Edwards (1982). Out of the Crisis, Center for Advanced Engineering Study, Massachusetts Institute of Technology, Cambridge, Massachusetts.
Your Complete, Cloud-Based Safety Solution
An online, integrated platform to protect your team,
reduce risk, and stay compliant